
Teaching

Teaching resources I like
Health Inequalities & Inequities

City maps and data that show health outcomes, social and economic factors, health behaviors, physical environment, and clinical care. Easy to use/pretty. You might have to explain to students how to read the income inequality.

Interactive data and charts on LGBT health, SES, victimization, barriers, discrimination, and stress. Easy to navigate.

Indiana University's data on crowdfunding during COVID. Pairs well with Igra et al.’s "Crowdfunding as a Response to Covid-19: Increasing Inequities at a Time of Crisis."
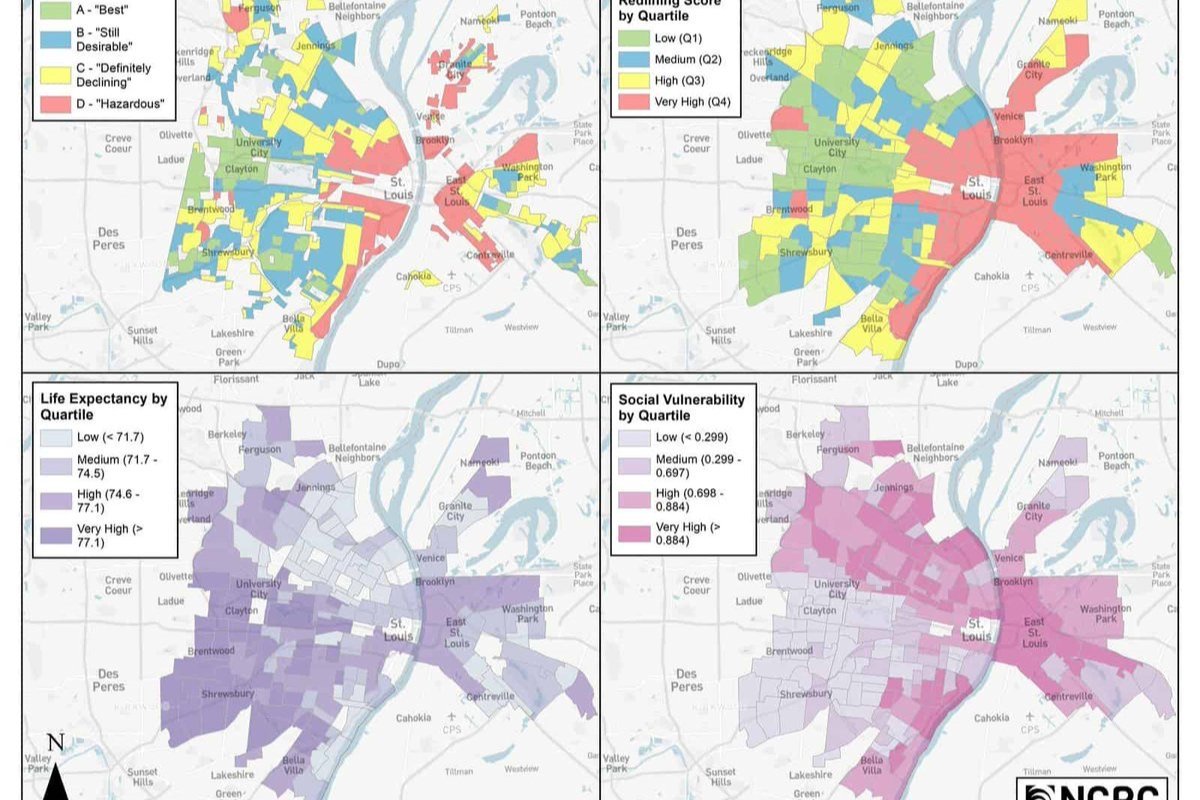
Illustrates the impact of redlining on health today. Great visualization. Compares redlining maps (with original descriptions of neighborhoods!) with current neighborhood maps.

Global data on vaccination behaviors and intentions.
Environmental Studies

Map of people's climate change opinions. It’s fun to explore… but it’s like… a scary-fun.

Environmental map. Can add demographic info onto map. It’s neat, but there is a lot going on… and I did not use this one well. Must offer students guidance on how to navigate.
In addition…

Complete collection of the Black Panther Party Newspapers. I had students analyze specific articles when I taught Alondra Nelson’s book, Body & Soul.

Data on immigrants’ employment sectors by state.

Map illustrating eviction rate. Includes data on: population, poverty rate, % renters, median rent, rent burden, median household income, etc. Can compare up to three states at once. I used this when I taught Desmond’s Evicted—not the whole book, just that one AJS article.
Activity tool: for students to create multiple choice quizzes. Buzzfeed is not really cool among the youths anymore, but this is still fun.